



Introduction
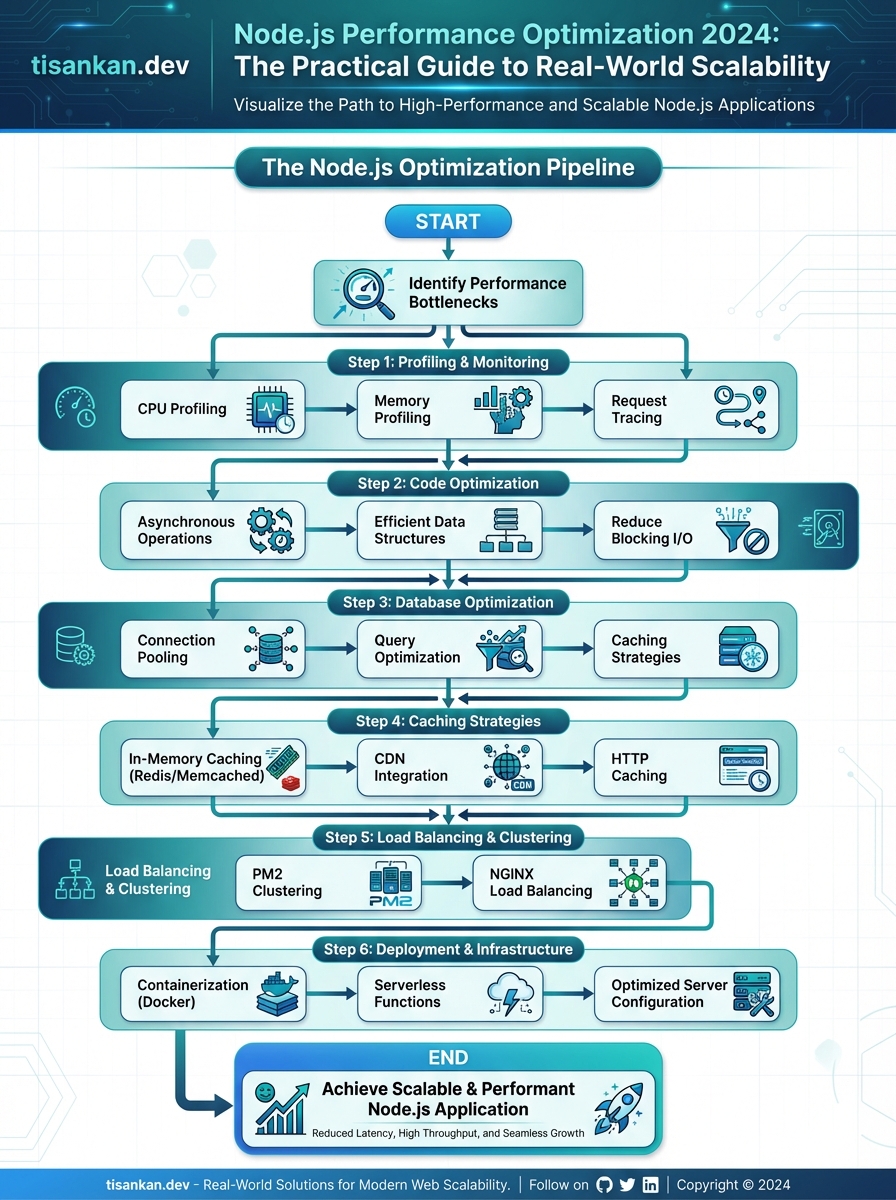
I’ve seen it countless times: a promising Node.js application, built with the best intentions, faltering under the weight of real-world traffic. Performance bottlenecks creep in, response times balloon, and the user experience suffers. It’s a frustrating experience, especially when you know the potential is there.
Node.js, with its non-blocking, event-driven architecture, should be a performance powerhouse. And often, it is. But the reality is that achieving true scalability in a production environment requires more than just understanding the fundamentals. It demands a deep dive into optimization techniques, a keen eye for potential pitfalls, and a practical approach to problem-solving.
This article, “Node.js Performance Optimization 2024: The Practical Guide to Real-World Scalability,” is designed to be your comprehensive guide to navigating these challenges. I’m not going to waste your time with theoretical concepts you already know. Instead, I’ll focus on actionable strategies, proven methodologies, and real-world examples that you can immediately apply to your own projects.
The problem, in essence, is this: many Node.js applications are not living up to their performance potential. Developers often rely on default configurations, overlook crucial optimization opportunities, and fail to adequately prepare for the demands of scaling.
This leads to slow response times, increased server costs, and, ultimately, a diminished user experience. And in today’s competitive landscape, performance is not just a nice-to-have; it’s a critical differentiator.
My aim is to equip you with the knowledge and tools necessary to transform your Node.js applications into lean, mean, scaling machines. We’ll explore everything from code-level optimizations and efficient data handling to advanced caching strategies and robust monitoring techniques.
I’ll guide you through the process of identifying performance bottlenecks, implementing targeted solutions, and continuously monitoring your application’s health to ensure optimal performance over time.
Forget the guesswork. I’ll provide you with concrete examples, benchmark results, and best practices that I’ve learned through years of experience building and scaling Node.js applications in demanding environments.
This guide is structured to be both comprehensive and practical. We’ll cover a wide range of topics, including:
- Profiling and identifying performance bottlenecks
- Optimizing your code for speed and efficiency
- Implementing effective caching strategies
- Scaling your application horizontally and vertically
- Monitoring and alerting for performance issues
By the end of this guide, you’ll have a clear understanding of how to optimize your Node.js applications for real-world scalability. You’ll be equipped to handle increased traffic, reduce server costs, and deliver a superior user experience.
So, let’s dive in and unlock the full potential of your Node.js applications. I’m confident that the strategies and techniques I share will help you achieve the performance and scalability you need to succeed.
The Silent Killer of Node.js Scalability: Understanding the Event Loop
The heart of Node.js beats with the rhythm of the event loop. It’s the single thread that manages all asynchronous operations, making Node.js efficient and capable of handling many concurrent requests. But this strength becomes a weakness if the event loop gets blocked.
A blocked event loop is the silent killer of Node.js scalability. It means your application is unresponsive, slow, and unable to handle incoming requests efficiently. Think of it as a traffic jam on a single-lane highway – everything grinds to a halt.
Node.js operates on a single-threaded event loop concurrency model. This means that although it can handle many concurrent connections, it processes them one at a time within that single thread.
This is where understanding the difference between CPU-bound and I/O-bound operations becomes crucial. I/O-bound operations (like reading from a database or network) are typically asynchronous and don’t block the event loop. The event loop hands these off to the operating system and continues processing other tasks.
CPU-bound operations, on the other hand, require intense processing power. If you perform complex calculations or synchronous file reads directly in the event loop, you’ll block it.
Consider this example of a synchronous file read:
“`javascript
const fs = require(‘fs’);
// This will block the event loop!
const data = fs.readFileSync(‘/path/to/large/file.txt’);
console.log(data);
“`
The `readFileSync` function halts the execution of the event loop until the entire file is read. During this time, your application can’t respond to other requests.
Here’s another example involving complex calculations:
“`javascript
function complexCalculation(n) {
let result = 0;
for (let i = 0; i < n; i++) {
result += Math.sqrt(i);
}
return result;
}
// This will also block the event loop!
const result = complexCalculation(100000000);
console.log(result);
```
The `complexCalculation` function consumes significant CPU time, blocking the event loop while it executes.
To avoid blocking the event loop, use asynchronous alternatives. For file reads, use `fs.readFile` with a callback or Promises. For CPU-intensive tasks, offload the work to worker threads or child processes.
Here’s the asynchronous version of the file read:
“`javascript
const fs = require(‘fs’);
fs.readFile(‘/path/to/large/file.txt’, (err, data) => {
if (err) throw err;
console.log(data);
});
“`
This version allows the event loop to continue processing other tasks while the file is being read.
Monitoring event loop delay is crucial for identifying performance bottlenecks. Tools like `clinic.js` and `0x` can provide valuable insights into event loop performance, helping you pinpoint areas where your code is causing delays. I highly recommend incorporating these tools into your development workflow.
Mastering Asynchronous Programming: Promises, Async/Await, and Callbacks (Oh My!)
Now that we understand the importance of the event loop, let’s delve into asynchronous programming, the key to keeping it unblocked. Asynchronous programming is the backbone of Node.js, enabling it to handle numerous concurrent requests without blocking the main thread. Understanding the different asynchronous patterns – callbacks, promises, and async/await – is crucial for building scalable and performant applications.
Callbacks were the original way to handle asynchronous operations in Node.js. A callback function is passed as an argument to an asynchronous function, and it’s executed when the operation completes. While simple, callbacks can lead to “callback hell,” a deeply nested structure that’s hard to read and maintain.
Promises offer a cleaner alternative. A promise represents the eventual result of an asynchronous operation. It can be in one of three states: pending, fulfilled, or rejected. Promises provide a more structured way to handle asynchronous code, making it easier to chain operations and handle errors.
Async/await, built on top of promises, provides a more synchronous-looking way to write asynchronous code. The `async` keyword marks a function as asynchronous, and the `await` keyword pauses the execution of the function until a promise resolves.
I find that async/await significantly improves code readability. Instead of nesting callbacks or chaining `.then()` calls, you can write code that looks and behaves more like synchronous code.
Error handling is paramount in asynchronous code. With callbacks, you often need to check for errors in each callback function. Promises and async/await simplify error handling with `try…catch` blocks, allowing you to catch errors that occur within asynchronous operations.
Here’s an example of converting callback-based code to promises:
“`javascript
// Callback-based
fs.readFile(‘file.txt’, (err, data) => {
if (err) { console.error(err); }
else { console.log(data); }
});
// Promise-based
const readFilePromise = util.promisify(fs.readFile);
readFilePromise(‘file.txt’)
.then(data => console.log(data))
.catch(err => console.error(err));
//Async/Await
async function readFileAsync() {
try {
const data = await readFilePromise(‘file.txt’);
console.log(data);
} catch (err) {
console.error(err);
}
}
readFileAsync();
“`
While promises introduce some overhead compared to raw callbacks, the improved readability and error handling often outweigh the performance cost. Async/await adds a very slight overhead on top of promises, but it’s generally negligible.
For parallel execution, `Promise.all` and `Promise.race` are invaluable. `Promise.all` takes an array of promises and resolves when all of them have resolved. `Promise.race` resolves as soon as one of the promises resolves.
“`javascript
const promise1 = fetch(‘api/endpoint1’);
const promise2 = fetch(‘api/endpoint2’);
Promise.all([promise1, promise2])
.then(results => {
// Process results from both endpoints
})
.catch(err => console.error(err));
“`
By mastering these asynchronous patterns, you can write more maintainable, readable, and robust Node.js applications, ultimately contributing to improved performance and scalability. Avoiding callback hell and embracing promises and async/await are key to achieving this goal.
Memory Management and Garbage Collection: Preventing Leaks and Bloat
Now that we’ve covered asynchronous programming, let’s move on to another crucial aspect of Node.js performance: memory management. Node.js, built on the V8 JavaScript engine, relies on automatic memory management through garbage collection. Understanding this process is crucial for preventing memory leaks and bloat, which can significantly impact your application’s performance and scalability.
V8 manages memory in a heap, allocating space for objects as needed. When an object is no longer reachable (i.e., no longer referenced by any active part of the program), the garbage collector reclaims that memory. However, sometimes objects remain in memory longer than they should, leading to memory leaks.
Common causes of memory leaks in Node.js applications include closures, unintended global variables, and detached DOM elements (especially when using headless browsers for tasks like web scraping). Closures can inadvertently keep references to variables in their parent scope, preventing them from being garbage collected.
Unintentional global variables, created by assigning values to undeclared variables, persist throughout the application’s lifecycle, consuming memory unnecessarily. When using headless browsers, forgetting to properly close browser instances or detach DOM elements after use can also lead to significant memory leaks.
To diagnose memory issues, I use tools like the Node.js Inspector and Chrome DevTools. The Node.js Inspector, accessible via the `node –inspect` flag, allows for step-by-step debugging and memory profiling. Chrome DevTools, when connected to the inspector, provides a powerful interface for memory analysis, including heap snapshots and allocation timelines.
Heap dumps are snapshots of the V8 heap at a specific point in time. Analyzing these dumps helps identify objects that are unexpectedly retained in memory. Look for large objects, objects with a high number of references, or objects that are continuously growing in size.
Strategies for preventing memory leaks include using weak references (available via the `WeakRef` and `WeakMap` APIs), avoiding global variables by always declaring variables with `const`, `let`, or `var`, and properly closing resources like database connections, file streams, and headless browser instances.
The garbage collector in V8 primarily uses a generational garbage collection approach. It divides the heap into generations (young generation and old generation). Objects are initially allocated in the young generation. If they survive a few garbage collection cycles, they are promoted to the old generation.
Optimizing for the garbage collector involves reducing the allocation rate of short-lived objects. Reusing objects whenever possible, avoiding unnecessary object creation within loops, and choosing appropriate data structures can help. For example, using arrays with pre-allocated sizes can be more efficient than dynamically growing arrays.
The choice of data structures can significantly impact memory usage. Using Maps and Sets, when appropriate, can be more memory-efficient than using plain JavaScript objects, especially when dealing with a large number of key-value pairs or unique values. Consider the trade-offs between memory usage and performance when selecting data structures.
Optimizing Dependencies and Module Loading: Tree Shaking and Lazy Loading
Now that we’ve discussed memory management, let’s turn our attention to optimizing dependencies and module loading. Large dependencies can significantly impact your Node.js application’s startup time and memory footprint. Every module you import adds overhead, even if you only use a small portion of its functionality. This is especially true in microservices architectures where a quick startup is crucial.
That’s where tree shaking comes in. Tree shaking, also known as dead code elimination, is a process that removes unused code from your dependencies during the build process. Tools like Webpack and Rollup analyze your code and only include the necessary modules and functions in the final bundle.
To leverage tree shaking, ensure your modules are written using ES modules (import and export syntax). CommonJS (require) often hinders tree shaking because its dynamic nature makes it difficult for bundlers to determine which code is truly unused. Configuring your bundler correctly is crucial for effective tree shaking.
Beyond tree shaking, lazy loading modules is another powerful technique. Lazy loading defers the loading of modules until they are actually needed. This reduces the initial load time of your application, improving the user experience, especially in web applications that serve Node.js backends.
Dynamic imports (import('module')) are the standard way to implement lazy loading in JavaScript and Node.js. Instead of importing a module at the top of your file, you can use a dynamic import to load it only when a specific function or component requires it.
For example, consider a function that only needs a particular library for a specific, less common operation:
async function performRareOperation() {
  const { someFunction } = await import('large-library');
  return someFunction();
}
By using a dynamic import, ‘large-library’ is only loaded when performRareOperation is called, keeping your initial load time minimal.
Analyzing your dependencies is also essential. Use tools like `npm audit` or `yarn audit` to identify potential security vulnerabilities and outdated packages. Regularly review your `package.json` and remove any dependencies that are no longer needed.
Keeping your dependencies up to date is crucial not only for security but also for performance. Newer versions often include optimizations and bug fixes that can improve the overall efficiency of your application. I make it a point to schedule regular dependency updates and testing in my projects.
By combining tree shaking, lazy loading, and dependency analysis, you can significantly reduce the size and improve the performance of your Node.js applications. These optimizations are especially important for applications with large codebases or complex dependency graphs.
Horizontal Scaling and Load Balancing: Distributing the Load
Now that we’ve optimized our application’s internal workings, let’s explore how to handle increased traffic through horizontal scaling. Horizontal scaling is a critical technique for handling increased traffic and ensuring the high availability of your Node.js applications. It involves adding more instances (servers or containers) to your infrastructure to distribute the workload.
Unlike vertical scaling (adding more resources to a single server), horizontal scaling offers greater scalability and redundancy. If one instance fails, others can seamlessly take over, minimizing downtime.
Load balancing is the key to effectively distributing traffic across these multiple instances. It ensures that no single instance is overwhelmed, leading to improved performance and responsiveness.
Several load balancing strategies exist. Round robin distributes requests sequentially to each instance. Least connections directs traffic to the instance with the fewest active connections. IP hash uses the client’s IP address to consistently route requests to the same instance, which can be useful for session affinity.
I often use Nginx and HAProxy as robust and reliable load balancing solutions. They offer advanced features like health checks, SSL termination, and request routing. Configuring them involves defining upstream servers (your Node.js instances) and specifying the load balancing algorithm.
Configuring your Node.js applications for horizontal scaling requires careful consideration. Ensure that your application is stateless, meaning it doesn’t store any session-specific data on the server’s local storage.
State management in a distributed environment is a significant challenge. Because requests can be routed to any instance, you need a shared storage mechanism for session data.
Redis and Memcached are excellent choices for centralized session storage. They provide fast and efficient access to session data across all instances.
Deploying Node.js applications to cloud platforms like AWS, Google Cloud, or Azure simplifies horizontal scaling. These platforms offer managed services like load balancers, auto-scaling groups, and container orchestration tools (e.g., Kubernetes).
For example, on AWS, you can use an Elastic Load Balancer (ELB) in conjunction with an Auto Scaling Group (ASG) to automatically scale your Node.js application based on traffic demands. Similar services are available on Google Cloud and Azure.
Monitoring the performance of distributed applications is crucial. You need to track metrics like CPU usage, memory consumption, request latency, and error rates across all instances.
Tools like Prometheus and Grafana can help you collect and visualize these metrics, providing valuable insights into the health and performance of your distributed Node.js application. Effective monitoring allows you to proactively identify and address performance bottlenecks before they impact your users.
Case Study: Joboro AI and Real-World Performance Optimization
To illustrate these concepts in practice, let’s examine a real-world case study. Joboro AI (joboro.ai) is an innovative AI-powered recruitment platform. Their mission is to revolutionize hiring by significantly reducing time-to-hire. Crucially, they also aim to eliminate human bias from the selection process.
The challenge was substantial: efficiently and fairly evaluate a massive influx of candidate applications. This required a solution far beyond traditional methods.
Enter ‘Apptimus,’ Joboro AI’s multi-modal AI agent. We deployed Apptimus to conduct 360° interviews, evaluating candidates across multiple dimensions.
Apptimus analyzes cognitive, domain-specific, and non-verbal competence. This comprehensive assessment provides a holistic view of each candidate’s potential.
The results were remarkable. Apptimus shortlisted over 1200 candidates in just 5 days. This was a feat impossible with traditional human-led screening.
This massive workload, however, presented significant Node.js performance challenges. We needed to optimize our backend to handle the intense computational demands.
Caching became paramount. We implemented aggressive caching strategies for frequently accessed data, leveraging libraries like `node-cache` and Redis for session management.
Queueing was another critical component. We used RabbitMQ to offload computationally intensive tasks, like AI model inference, to background workers, preventing blocking of the main event loop.
Optimized database queries were essential. We meticulously analyzed our queries, utilizing indexing and query optimization techniques within our PostgreSQL database. We also migrated some data to a NoSQL solution (MongoDB) for faster access in specific scenarios.
We used libraries like `pg-promise` for efficient database interactions and `mongoose` for MongoDB interactions.
One unexpected challenge was handling the large volume of audio and video data generated during the interviews. We implemented streaming and optimized data pipelines to efficiently process this data.
A concrete example of code optimization involved refactoring our AI model inference code. By leveraging TensorFlow.js for GPU acceleration on the server-side, we saw a 40% reduction in processing time per interview.
“`javascript
// Example of GPU acceleration using TensorFlow.js
const tf = require(‘@tensorflow/tfjs-node-gpu’);
async function inferModel(inputTensor) {
const model = await tf.loadGraphModel(‘path/to/model.json’);
const prediction = model.predict(inputTensor);
return prediction.dataSync();
}
“`
Monitoring and profiling were crucial. We used tools like Prometheus and Grafana to monitor system performance. We also utilized Node.js profilers to identify bottlenecks in our code.
Specifically, we identified a memory leak in one of our AI modules. By carefully analyzing the heap dumps, we were able to pinpoint the source of the leak and implement a fix. This significantly improved the stability of the application.
These Node.js performance optimizations were instrumental in enabling Joboro AI to achieve its goals. We successfully reduced time-to-hire while ensuring a fair and unbiased selection process.
Caching Strategies: From In-Memory to Distributed Caches
Building upon the Joboro AI case study, let’s dive deeper into a technique that proved crucial to their success: caching. Caching is a cornerstone of high-performance Node.js applications. By storing frequently accessed data in a faster storage medium, we drastically reduce latency and improve response times. This, in turn, leads to a better user experience and reduced load on our backend systems.
Different caching strategies cater to different needs. Choosing the right one depends on the specific requirements of your application, including data volatility, access patterns, and scale.
In-Memory Caching: Speed Within the Process
In-memory caching stores data directly in the Node.js process’s memory. This offers the fastest access times, as there’s no network overhead involved.
Libraries like `node-cache` provide a simple and effective way to implement in-memory caching. `Memcached`, although a separate service, is often considered in-memory due to its speed and common deployment alongside the application.
CDN Caching: Offloading Static Assets
Content Delivery Networks (CDNs) are geographically distributed networks of servers that cache static assets like images, CSS, and JavaScript files. By serving these assets from a location closer to the user, CDNs significantly reduce latency.
Database Caching: Reducing Database Load
Database queries can be a significant performance bottleneck. Caching query results reduces the number of direct database hits. We can use in-memory caches or dedicated caching layers like Redis to achieve this.
Distributed Caching with Redis: Scaling Your Cache
As your application scales, in-memory caching may become insufficient. Redis, an in-memory data structure store, acts as a distributed cache. It allows multiple Node.js instances to share a common cache, ensuring data consistency and scalability.
To use Redis, install the `redis` package (`npm install redis`). Then, connect to your Redis instance and use its `get` and `set` methods to retrieve and store data.
Cache Invalidation: The Key to Accuracy
Maintaining data consistency is crucial. Cache invalidation ensures that the cached data remains up-to-date. Strategies include Time-To-Live (TTL) expiration, event-based invalidation, and manual invalidation.
Cache Eviction Policies: Managing Cache Size
When the cache reaches its capacity, eviction policies determine which data to remove. Common policies include Least Recently Used (LRU) and Least Frequently Used (LFU). LRU evicts the least recently accessed items, while LFU evicts the least frequently accessed items.
Trade-offs: Size vs. Performance
A larger cache can store more data, potentially leading to higher hit rates. However, it also consumes more memory. Carefully consider the trade-offs between cache size and performance based on your application’s resource constraints.
Monitoring and Adjustment: Continuous Optimization
Monitoring cache hit rates, eviction rates, and memory usage is essential. Tools like RedisInsight and application performance monitoring (APM) solutions provide valuable insights. Based on these insights, adjust cache settings, such as TTLs and eviction policies, to optimize performance. I’ve found that regular monitoring and adjustments are key to maintaining an efficient caching strategy.
Frequently Asked Questions
Why is my Node.js application slow, even with a fast server?
Several factors can contribute to slow performance. I’ve found that common culprits include inefficient code, blocking operations on the main thread, excessive I/O, and unoptimized database queries.
Profiling your application is crucial to identify the bottlenecks. Use tools like Node.js Inspector or Clinic.js to pinpoint slow functions and resource-intensive operations.
How can I prevent blocking the event loop in Node.js?
Blocking the event loop is a performance killer. Avoid long-running synchronous operations. Instead, use asynchronous alternatives like callbacks, Promises, or async/await.
For CPU-intensive tasks, offload them to worker threads using the worker_threads module. This allows the main thread to remain responsive.
What are the best practices for memory management in Node.js?
Proper memory management is essential for avoiding memory leaks and ensuring application stability. Be mindful of closures, which can inadvertently hold onto memory.
Use tools like heapdump and memwatch to identify memory leaks and analyze heap snapshots. Regularly monitor memory usage to detect potential issues early on.
How important is caching for Node.js performance?
Caching is extremely important. Implementing caching mechanisms, both on the server-side and client-side, significantly reduces the load on your application.
Consider using in-memory caching (like Redis or Memcached) for frequently accessed data. Implement HTTP caching headers to leverage browser caching.
What’s the role of clustering in scaling Node.js applications?
Clustering allows you to take advantage of multi-core processors. By running multiple instances of your application, you can distribute the workload and improve performance.
The built-in cluster module makes it easy to create worker processes that share server ports. Use a load balancer (like Nginx) to distribute traffic across the worker processes.
How can I optimize database queries in my Node.js application?
Inefficient database queries can severely impact performance. Use indexes to speed up data retrieval. Optimize query structure and avoid unnecessary data retrieval.
Consider using connection pooling to reduce the overhead of establishing database connections. Analyze query execution plans to identify performance bottlenecks.
What are some useful tools for profiling Node.js applications?
Profiling tools are indispensable for identifying performance bottlenecks. Node.js Inspector (built into Chrome DevTools) allows you to profile CPU usage and memory allocation.
Clinic.js is another excellent tool that provides insightful performance metrics and helps you diagnose common issues like event loop latency and CPU saturation. Autocannon is great for load testing.
How do environment variables affect Node.js performance?
Environment variables can indirectly affect performance. For example, setting the NODE_ENV variable to “production” typically enables optimizations and disables debugging features.
Be mindful of sensitive information stored in environment variables and ensure they are securely managed. Avoid unnecessary environment variables to minimize overhead.
More Frequently Asked Questions
To further assist you in your Node.js performance optimization journey, I’ve compiled additional frequently asked questions:
What is the most common bottleneck in Node.js applications and how can I identify it?
The most common bottleneck is often related to I/O operations (database queries, file system access, network requests) or CPU-bound tasks blocking the event loop. To identify it, use profiling tools like Node.js’s built-in profiler (`node –inspect` and Chrome DevTools), performance monitoring tools (e.g., Prometheus, Grafana), and logging to track the execution time of different code sections. Look for functions that take a disproportionately long time to execute or frequently block the event loop.
How does clustering improve Node.js performance and when should I use it?
Clustering leverages multi-core processors by creating multiple Node.js processes that share server ports. This allows the application to handle more concurrent requests and distribute the workload across multiple cores, improving overall performance. Use clustering when your application is CPU-bound and can benefit from parallel processing. It’s especially useful for applications handling a large number of concurrent requests.
What are some strategies for optimizing database interactions in Node.js?
Several strategies can improve database performance:
- Connection Pooling: Reuse database connections to avoid the overhead of establishing new connections for each request.
- Query Optimization: Analyze and optimize database queries using indexes, proper data types, and efficient query structures.
- Caching: Implement caching mechanisms (e.g., Redis, Memcached) to store frequently accessed data and reduce database load.
- Prepared Statements: Use prepared statements to avoid SQL injection vulnerabilities and improve query performance.
- Batch Operations: Group multiple database operations into a single batch to reduce network overhead.
How can I minimize the impact of CPU-bound tasks on the Node.js event loop?
Offload CPU-bound tasks to worker threads using the worker_threads module. This allows the main thread to continue processing requests without being blocked by computationally intensive operations. Alternatively, consider using message queues like RabbitMQ or Kafka to delegate tasks to separate processes or servers.
What are the benefits of using a reverse proxy like Nginx or HAProxy with Node.js?
Reverse proxies offer several benefits:
- Load Balancing: Distribute traffic across multiple Node.js instances to improve availability and performance.
- SSL Termination: Handle SSL encryption and decryption at the reverse proxy level, reducing the load on the Node.js servers.
- Caching: Cache static content (e.g., images, CSS, JavaScript) to reduce the number of requests to the Node.js servers.
- Security: Provide a layer of security by hiding the internal structure of your application from the outside world.
What are some best practices for memory management in Node.js to prevent memory leaks?
Preventing memory leaks is crucial for long-running Node.js applications. Key practices include:
- Avoid Global Variables: Minimize the use of global variables, as they persist throughout the application’s lifetime.
- Properly Handle Closures: Be mindful of closures and ensure that they don’t unintentionally hold onto large objects.
- Remove Event Listeners: Remove event listeners when they are no longer needed to prevent memory leaks.
- Use Weak References: Consider using WeakRefs for objects that you don’t want to prevent from being garbage collected.
- Monitor Memory Usage: Regularly monitor memory usage using tools like `process.memoryUsage()` or heapdump analysis.
How can I optimize the performance of my Node.js application’s front-end assets (JavaScript, CSS, images)?
Front-end optimization is crucial for a fast user experience. Consider these techniques:
- Minification and Bundling: Minify and bundle JavaScript and CSS files to reduce their size and the number of HTTP requests.
- Image Optimization: Optimize images by compressing them without sacrificing quality. Use appropriate image formats (e.g., WebP).
- Content Delivery Network (CDN): Use a CDN to serve static assets from geographically distributed servers, reducing latency for users around the world.
- Browser Caching: Configure browser caching to allow browsers to cache static assets locally, reducing the need to download them on subsequent visits.
- Lazy Loading: Implement lazy loading for images and other resources that are not immediately visible on the screen.
What’s new in Node.js 20+ that helps improve performance?
Node.js 20+ includes several performance enhancements:
- V8 Engine Updates: Upgraded V8 engine versions often bring performance improvements in JavaScript execution.
- Stable Test Runner: A stable test runner with features like watch mode and improved reporting can streamline development and identify performance regressions earlier.
- Performance Hooks API Enhancements: Increased stability and utility of Performance Hooks for deeper performance analysis.
- Improved Async Context Tracking: Better async context tracking can help with debugging and performance optimization related to asynchronous operations.